Datadog vs Grafana: Which Fits a 5-50 Engineer Team?
Summary
Datadog vs Grafana comes down to who owns the pager at 3am and what they already run. Datadog ships a working dashboard within minutes through agent auto-discovery and layers an AI agent on top of alerts, but its per-host, per-signal pricing gets expensive past roughly 50 hosts. Grafana's Free Forever tier and open-standards stack (Prometheus, OpenTelemetry, Loki) keep the bill predictable, provided someone on the team operates it. For a 5-to-50-engineer shop without a dedicated platform hire, Datadog wins on time-to-value; teams already running OpenTelemetry should default to Grafana.
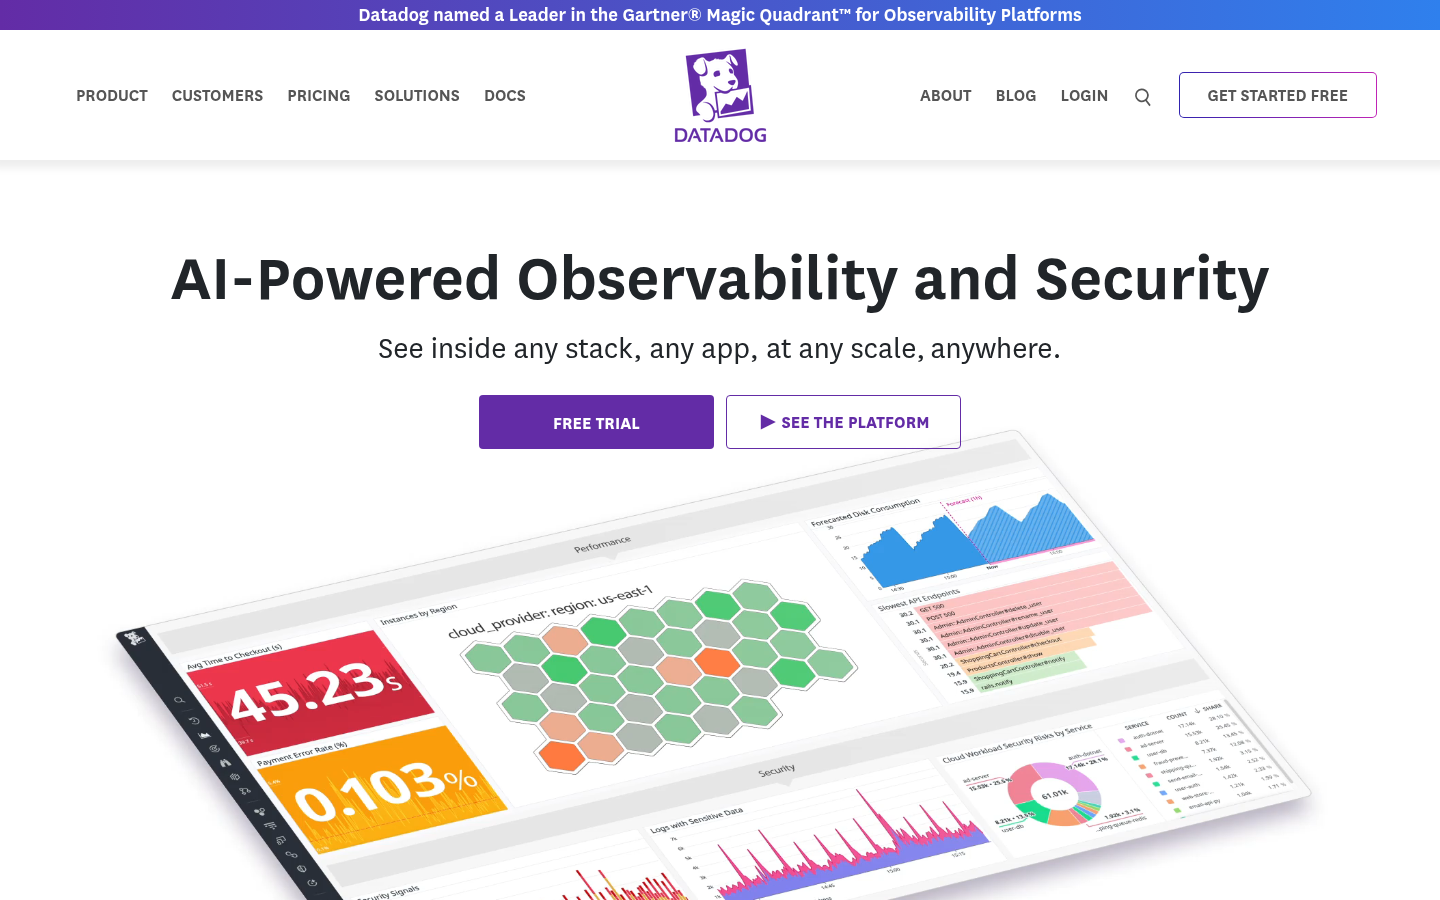
Datadog
- Agent auto-discovery ships working dashboards within minutes of install
- One query language across infra, APM, logs, RUM, and synthetics
- Bits AI SRE Agent drafts remediation steps the moment an alert fires
- Per-host plus per-signal billing compounds fast once you pass roughly 50 hosts
- SaaS-only, so there is no self-hosted escape hatch from pricing or roadmap changes
- Custom metrics and high-cardinality tags are the most common source of surprise invoices
Best when the team needs an answer today and can budget for the convenience.
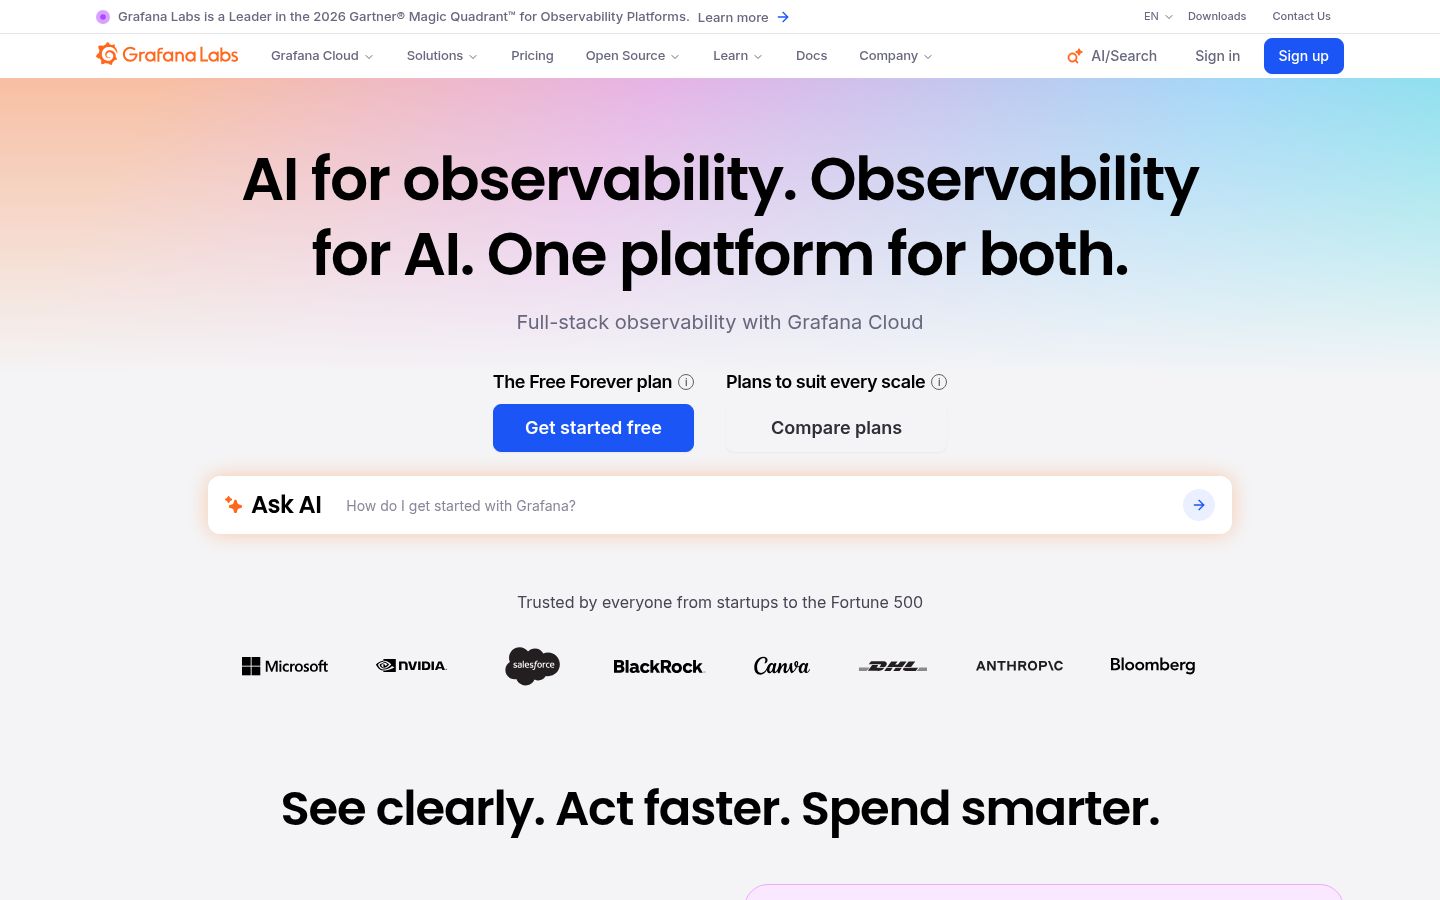
Grafana
- Free Forever tier covers real workloads: 10K metric series plus 50GB each of logs, traces, and profiles
- Built on open standards (Prometheus, OpenTelemetry, Loki), so there is no proprietary agent lock-in
- SLO definitions and alert rules live in the same object, so gates do not quietly drift from the dashboard
- Self-hosting means assembling and operating Prometheus, Loki, and Tempo before the first dashboard exists
- No native AI incident-remediation agent, since Adaptive Telemetry targets cost control rather than MTTR
- Correlating metrics to traces to logs takes more manual wiring than a single-vendor SaaS stack
Best when the stack already speaks Prometheus and the team wants to stop guessing at next month's bill.
At-a-glance
| Datadog | Grafana | |
|---|---|---|
| Pricing model | $15-23/host/mo infra (annual) + $31/host/mo APM, billed separately per signal | $19/mo platform fee + $6.50 per 1,000 metric series, itemized per signal |
| Free tier | 14-day trial only, no permanent free plan | Free Forever: 10K metric series, 50GB logs, 50GB traces, 50GB profiles/mo |
| Self-hosted option | No, SaaS only | Yes, full LGTM stack (Loki, Tempo, Mimir) self-hostable at infra cost |
| Time to first working dashboard | Minutes; agent auto-discovers services and ships default dashboards | Minutes on Grafana Cloud with existing OTel data; days if self-hosting from scratch |
| AI incident assistance | Bits AI SRE Agent proposes remediation steps on alert | None native; Adaptive Telemetry targets cost control, not MTTR |
Verdict
Datadog wins this specific matchup: a team of 5 to 50 engineers without a dedicated platform hire gets a working, AI-assisted dashboard the same day they install the agent, and that head start is worth the premium below roughly 50 hosts. Grafana remains the better long-term bet the moment your infrastructure already speaks Prometheus or OpenTelemetry, since the Free Forever tier and itemized billing remove the vendor-lock-in tax entirely. Pick Datadog to move fast now, pick Grafana to keep the exit door open.
How we tested
We compared Datadog and Grafana on their public 2026 pricing pages, product documentation, and independent review aggregators (G2, Capterra, TrustRadius) rather than vendor sales decks. Pricing figures are the vendors' own published rates as of September 2026, cross-checked against Datadog's infrastructure, APM, and log-ingestion pricing pages and Grafana Cloud's usage-based calculator. Customer sentiment comes from G2's verified-review scores (Datadog 4.4/5 across 726 reviews, Grafana Labs 4.5/5 across 204 reviews) rather than a single tester's opinion. We did not use either vendor's free trial credits or briefing materials to shape the verdict.
Datadog vs Grafana usually gets framed as a dashboard preference. It is not. The real fork in the road is whether your 5-to-50-person engineering team has someone whose job is to run an observability stack, or whether that job is "whoever is on call this week." Datadog wins this specific matchup for teams without a dedicated platform hire: install the agent, get a working dashboard in minutes, let an AI agent draft the first remediation step. Grafana wins the moment your infrastructure already speaks Prometheus or OpenTelemetry, because its Free Forever tier removes the vendor-lock-in tax entirely.
The real question: who is assembling the stack
You have felt this before: a request starts timing out at 2am, and the first ten minutes of debugging are not spent reading code, they are spent finding a dashboard that shows which service is actually slow. That gap between "something is wrong" and "here is the file to open" is what these two tools sell.
Datadog closes it for you. Install one agent, and it auto-discovers your services, containers, and databases, then ships default dashboards without anyone writing a single query. Grafana can close the same gap, but only after someone has wired Prometheus for metrics, Loki for logs, and Tempo for traces into it.
Neither approach is wrong. They assume a different team.
The wrong question to ask here is which product has more features. Both platforms cover metrics, logs, traces, and alerting at this point; the feature checklists read almost identically in a sales deck. The question that actually predicts whether you will be happy with the choice in six months is staffing: does anyone on the team already know Prometheus, or will the first person to touch the observability stack be learning it under incident pressure.
What a working dashboard costs on day one
Datadog's SaaS model means there is no infrastructure to stand up: sign up, run the install script, and metrics start flowing.
DD_API_KEY=<your_key> DD_SITE="datadoghq.com" bash -c "$(curl -L https://s3.amazonaws.com/dd-agent/scripts/install_script_agent7.sh)"Fifteen minutes later, the agent has fingerprinted your Postgres instance, your nginx containers, and your Redis cluster, and shipped dashboards for all three. Grafana's equivalent is a genuine project: pick an OpenTelemetry Collector, wire exporters for each signal, point them at Grafana Cloud or your own Mimir and Loki, and only then build the dashboard.
For a team of five engineers already stretched across product work, that difference is not cosmetic. It is the difference between observability shipped this sprint and observability as a Q3 initiative.
Where the Datadog bill quietly outgrows the team
The catch shows up later, not on day one. Datadog bills per host for infrastructure monitoring at $15-23/mo, separately per host for APM at $31/mo, and separately again for log ingestion by the gigabyte. A five-person team running a dozen services on a handful of hosts barely notices.
The same team six months later, now running one pod per microservice on Kubernetes, can watch host count balloon past 50 without changing headcount, and that is exactly the threshold where per-host, per-signal billing starts compounding. Custom metrics and high-cardinality tags make it worse: they are billed on top, and they are the single most common line item people do not see coming until the invoice arrives.
Grafana Cloud's pricing is uglier to read at first glance, a $19/mo platform fee plus $6.50 per 1,000 metric series, plus per-gigabyte logs and traces, but it is itemized against usage you can actually forecast from your own OpenTelemetry data, not against host count. See the G2 review breakdown for how often Datadog users flag billing surprises versus Grafana users.
What Bits AI does, and does not do, when an alert fires
Datadog's Bits AI SRE Agent is the one feature Grafana has no direct answer for. When an alert fires, it pulls the relevant logs, traces, and recent deploys, and proposes a remediation step instead of paging a human to start from zero. That is a genuine time-to-resolution advantage during an incident, particularly for a small team without a dedicated on-call rotation deep in observability tooling.
Grafana's closest feature, Adaptive Telemetry, solves a different problem: it trims which metrics you pay to store, which helps the bill, not the 3am debugging session. If AI-assisted incident response is the deciding factor, that is a real point for Datadog, not marketing copy.
The self-hosting tax nobody puts on the pricing page
Grafana's open source LGTM stack, Loki, Grafana, Tempo, and Mimir, can run entirely on your own infrastructure at cost, and that is a legitimate reason teams pick it: no vendor decides next year's price increase for you.
What the pricing page does not show is the engineer-hours spent keeping Prometheus scrape configs, Loki retention policies, and Tempo storage backends healthy as the system grows. That work does not disappear if you are not the one doing it, it just moves from a bill you can see to a calendar you cannot always see. Teams that already run Prometheus or OpenTelemetry for other reasons absorb this cost anyway; teams starting from zero are choosing to take it on.
How we compared them
We priced both platforms off their public 2026 pricing pages rather than sales calls, and weighted customer sentiment using verified reviews on TrustRadius instead of a single tester's opinion. Full methodology, including exact review scores and sample sizes, is in the box below.
We also deliberately excluded two common but weak signals: G2 badge counts (they correlate with marketing spend as much as product quality) and Reddit threads (loud, but not representative of the median user). What is left is public pricing, public documentation, and review-platform scores large enough to average out any single angry or ecstatic reviewer.
The actual call for a 5-to-50-person team
If nobody on the team has "observability" in their job title, Datadog buys time: a working, AI-assisted dashboard on day one, at a price that is reasonable below roughly 50 hosts. If the team already runs Prometheus or OpenTelemetry, or the roadmap includes a dedicated platform hire in the next two quarters, Grafana's Free Forever tier and itemized billing make more sense before the Datadog invoice becomes a recurring budget conversation.
Either way, the tool does not fix the underlying problem: production visibility only matters if it gets your team back to the actual code faster than grep would have.